|
Trend lines
|   |
|
Trend lines
| |
|
Trend lines in charts |
|
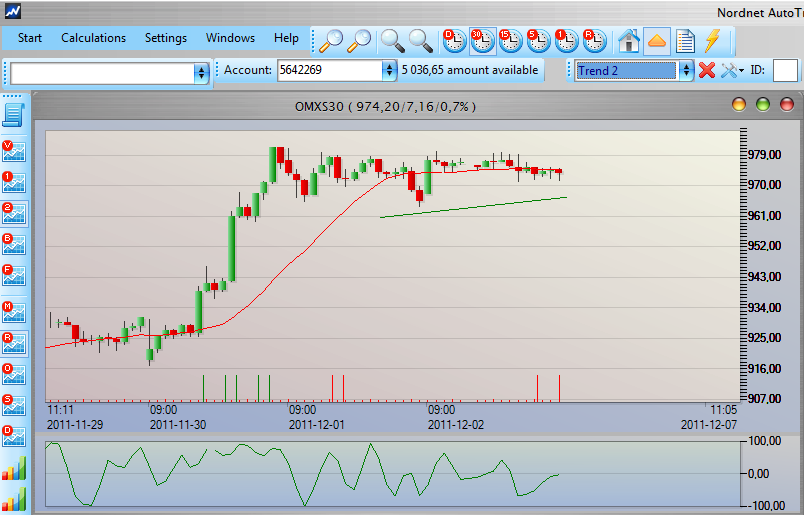
A useful feature is to draw trend lines in charts that can be used to trigger alarms locally, via email / SMS or automatic order. To draw a trendline in a chart, first click on the triangle icon to switch to "trend line mode":
Once you've selected Trend Mode can you draw a trend line in the same way that you normally zoom in on an area of the chart, click on the intended start of the line and drag the cursor to the intended end. Release the mouse button to display the trendline. You will be asked about the new trend line should be alerted trend line, No. 1 or nr2. If you answer no the trend line will receive the first available ID as passive line. The difference between alert and passive line is that the alarm triggers an alarm in My alerts and email / SMS when the price reaches outside the lines. A silent alarm yet, but can still be read from within a script to create alarms that trigger automatic orders etc. |
|
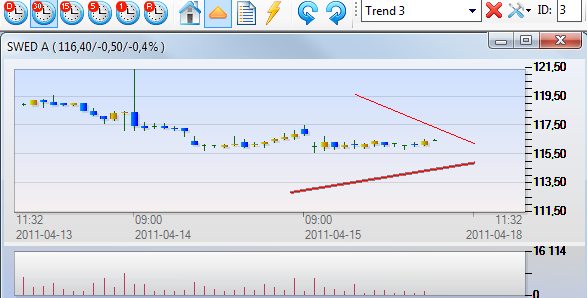
Change ID, display in charts and delete trend lines |
|
Each trend line has an ID that appears in the ID box when selected line, eg:
|